
Runtime warnings in libraries are a great way to notify your users that something unexpected has happened, or that an API is being used in an incorrect manner. There are a number of ways of handling this, from in-your-face assertion failures to easy-to-miss console logging. In this post we give an overview of some of those techniques that can be employed easily today, as well as discuss a technique for surfacing runtime warnings that is both very visible and unobtrusive.
Since the very early days of the Composable Architecture, we have performed certain checks inside the library to make sure that its APIs are being used properly. This first started with raising an assertion failure when we detected an action was sent to an optional reducer while state was nil. We did this because sending such an action is considered an application logic error and could hide subtle bugs in your application since the actions are being silently ignored. The assertion message provides a detailed explanation of why it was triggered, as well as how one might potentially fix it:

Although it is nice to be notified of these problems early and in a visible manner, it’s also quite disruptive. Because assertion failures crash the application you have no choice but to restart, which means you lose your current working context. Further, there are a lot more of these types of application logic errors we’d like to catch in the library, but that means we will be creating a minefield of assertion failures that our users can trip over. That creates an unhappy experience when using the library.
So, we looked for less obtrusive ways to surface these messages. One option is to simply print the messages to the console, but it is very easy for that to get lost amongst everything else being printed to the console. Perhaps a happy medium between terminating the application with an assertion failure and printing to the console would be to temporarily stop the application with a breakpoint.
Interestingly Apple’s Combine framework even ships with such a tool. The .breakpoint operator allows you to tell Combine to breakpoint in the middle of a publisher chain when a condition is met. This makes it easy to debug long, complex publisher chains, which are notoriously difficult to get insight into their internals.
Stopping a process with the debugger activated is as simple as raising a SIGTRAP signal, which in Swift can be accomplished like this:
raise(SIGTRAP)
However, raising SIGTRAP like this when the debugger is not attached will crash the process. So, a little extra work has to be done to first detect if the debugger is attached, and only if it is do we raise the signal:
/// Raises a debug breakpoint if a debugger is attached.
@inline(__always)
func breakpoint(_ message: @autoclosure () -> String = "") {
  #if DEBUG
    var name = [CTL_KERN, KERN_PROC, KERN_PROC_PID, getpid()]
    var info = kinfo_proc()
    var info_size = MemoryLayout<kinfo_proc>.size

    let isDebuggerAttached =
      sysctl(&name, 4, &info, &info_size, nil, 0) != -1
        && info.kp_proc.p_flag & P_TRACED != 0

    if isDebuggerAttached {
      fputs(
        """
        \(message())

        Caught debug breakpoint. \
        Type "continue" ("c") to resume execution.

        """,
        stderr
      )
      raise(SIGTRAP)
    }
  #endif
}
This style of runtime warnings is much better than assertion failures. It only temporarily stops the application, allowing the user to see why we are warning them and then they simply click the continue button (⌃⌘Y) or type “c” into the prompt to resume execution.
In fact, this new experience for runtime warnings was so much better we started sprinkle in more of them to catch even more application logic errors. This includes when actions are sent to .forEach reducers for ids that no longer exist in the collection (see here), as well as when SwitchStores are used in a non-exhaustive manner (see here), and most recently in order to perform certain thread checks in the Store and ViewStore (see here).
While using breakpoints provided a much better user experience than assertion failures, we still felt there was room for improvement. The fact that breakpoints were being triggered was not expected by our users and caused confusion. Many thought that their application was crashing, and that the only way to resume was to restart the application. Even worse, the stack trace at the moment of breakpoint doesn’t point exactly to where the SIGTRAP is raised, but rather there are a few un-symbolicated frames in front of your frame, which can be very confusing. And on top of all of that, getting caught on a breakpoint can still be quite disruptive to your workflow.
Xcode actually provides some really great, unobtrusive runtime warnings for certain things, such as when you mutate an ObservedObject being used in a SwiftUI view on a background thread:
Publishing changes from background threads is not allowed; make sure to publish values from the main thread (via operators like receive(on:)) on model updates.
It even helpfully lets you know how one usually fixes the problem.
Wouldn’t it be great if we could show these types of warnings instead of stopping the application on a breakpoint? It allows the user to test their application without us interrupting them, and we get a very visible way to raise warnings to their attention.
Unfortunately, Apple does not publicly expose APIs for creating these runtime warnings (we filed a feedback, and encourage you to do the same!). But, that doesn’t mean we can’t do some dynamic Swift runtime hacking to invoke private LLDB functions behind the scenes!
We came across an old Stack Overflow post where Saagar Jha (website) demonstrates a crude way to piggyback on the main thread checker to show custom purple warnings in Xcode. This was exciting to see, but sadly the warnings were denoted as being related to main thread checking, which would be strange to see for warnings that have nothing to do with threading.
So, we reached out to Saagar to see if there were other options. It turns out that the warnings can be generated by writing to a specific OSLog in a very specific manner. There is an overload of os_log that allows you to specify the type of log (e.g. default, info, debug, error, fault), an OSLog and then the string you want to log:
os_log(
  <#os.OSLogType#>,
  <#log: os.OSLog#>,
  <#StaticString#>,
  <#CVarArg#>
)
Some of these arguments are easier to fill in than others. For example, the type of log can be .fault to denote a system-level error, and the StaticString is just whatever we want to log:
os_log(
  .fault,
  log: <#os.OSLog#>,
  "We encountered a runtime warning"
)
For the log argument we can construct an OSLog from scratch that targets the subsystem “com.apple.runtime-issues”, and the category can be anything we want:
os_log(
  .fault,
  log: OSLog(
    subsystem: "com.apple.runtime-issues",
    category: "ComposableArchitecture"
  ),
  "We encountered a runtime warning"
)
This subsystem seems to be what Xcode watches in order to know when to show the runtime purple warnings in the editor. However, if we simply run an application with this logging performed immediately we will see that no purple warnings pop up.
It turns out that it is not enough to simply log to the subsystem. Historically it seems that these purple warnings could only be initiated from private, magic functions in LLDB, such as the thread sanitizer, undefined behavior sanitizer, and a few others. However, when SwiftUI launched, Apple privileged that framework with the ability to also create these warnings, and so if we can make it seem as if the os_log is happening from within SwiftUI we may trick Xcode into showing the purple warning.
To do this one must provide a dso argument to os_log, which sadly has very little documentation:
os_log(
  .fault,
  dso: <#UnsafeRawPointer#>,
  log: OSLog(
    subsystem: "com.apple.runtime-issues",
    category: "ComposableArchitecture"
  ),
  "We encountered a runtime warning"
)
The dso argument is just a nebulous UnsafeRawPointer. There is very little documentation on what exactly dso is or how to construct them. It’s an acronym for “dynamic shared object”, and there’s a Twitter thread from 2016 where Joe Groff alludes to it being used to identify a dynamic library, and so we need to somehow construct one that points to one of Apple’s libraries, in particular SwiftUI.
The way one opens dynamic libraries is via the dlopen function, which we’ve actually used before in our xctest-dynamic-overlay library for accessing XCTest symbols dynamically, which allows us to conditionally use XCTFail in code that was not built for testing.
Xcode does not provide any info on how to use dlopen, but it’s just a plain C function so we can access its man pages from terminal:
NAME
dlopen -- load and link a dynamic library or bundle

SYNOPSIS
#include <dlfcn.h>

void*
dlopen(const char* path, int mode);
The path is where we want to search for the dynamic library, which we can use nil if we want to search all paths, and the mode allows us to pass along various options for searching. The man pages suggest using RTLD_LAZY as a default, so that is what we will do:
dlopen(nil, RTLD_LAZY)
This returns an UnsafeMutableRawPointer?, which can be used to look up the address of a particular symbol using another C function, dlsym. Again we can refer to the man pages of this function to get some more information:
NAME
dlsym -- get address of a symbol

SYNOPSIS
#include <dlfcn.h>

void*
dlsym(void* handle, const char* symbol);
It takes a handle as the first argument, which is the thing returned to us from dlopen, and the symbol we want to search for as the second argument. Searching for a symbol in xctest-dynamic-overlay was quite easy because we were looking for a plain C function, and so could refer it by such directly. However there are no C functions in the SwiftUI framework. Instead we must find the name of a symbol in SwiftUI.framework, which can be difficult because Swift symbols are mangled to encode a lot of information about the symbol in a small, textual description.
Luckily Xcode ships with a tool for exploring of the symbol names in a framework, and it’s called nm. If you run the following command in terminal you will see over 52,000 symbols printed to the console:
$ nm -g /Applications/Xcode.app/Contents/Developer/Platforms/iPhoneOS.platform/Developer/SDKs/iPhoneOS.sdk/System/Library/Frameworks/SwiftUI.framework/SwiftUI.tbd

00000000 S _$s10Foundation15AttributeScopesO7SwiftUIE05swiftE0AcDE0D12UIAttributesVmvg
00000000 S _$s10Foundation15AttributeScopesO7SwiftUIE05swiftE0AcDE0D12UIAttributesVmvpMV
00000000 S _$s10Foundation15AttributeScopesO7SwiftUIE0D12UIAttributesV014BaselineOffsetB0O4nameSSvgZ
00000000 S _$s10Foundation15AttributeScopesO7SwiftUIE0D12UIAttributesV014BaselineOffsetB0OAA19AttributedStringKeyADMc
00000000 S _$s10Foundation15AttributeScopesO7SwiftUIE0D12UIAttributesV014BaselineOffsetB0OAA28DecodableAttributedStringKeyADMc
If you are curious what one of these mangled names represents you can use the swift demangle tool to get access to the Swift signature that you are more familiar with:
$ swift demangle s10Foundation15AttributeScopesO7SwiftUIE05swiftE0AcDE0D12UIAttributesVmvg

$s10Foundation15AttributeScopesO7SwiftUIE05swiftE0AcDE0D12UIAttributesVmvg ---> (extension in SwiftUI):Foundation.AttributeScopes.swiftUI.getter : (extension in SwiftUI):Foundation.AttributeScopes.SwiftUIAttributes.Type
We can chose one of the mangled symbol names and plug it into dlsym:
dlsym(
  dlopen(nil, RTLD_LAZY),
  """
  $s10Foundation15AttributeScopesO7Swif\
  tUIE05swiftE0AcDE0D12UIAttributesVmvg
  """
)
And this returns a UnsafeMutableRawPointer!. This is a handle to the address of the symbol we hard coded above, which we can finally use to find the dynamic library holding the symbol, i.e. SwiftUI. We can do this via the dladdr C function, which we can find some information from its man page:
NAME
dladdr -- find the image containing a given address

SYNOPSIS
#include <dlfcn.h>

int
dladdr(const void* addr, Dl_info* info);
This function takes an addr, which is the thing that dlsym returned, and a mutable info, which is a structuring containing a few fields. To invoke dladdr we need to construct a mutable Dl_info that we can pass as an inout:
var info = Dl_info()
dladdr(
  dlsym(
    dlopen(nil, RTLD_LAZY),
    """
    $s10Foundation15AttributeScopesO7Swif\
    tUIE05swiftE0AcDE0D12UIAttributesVmvg
    """
  ),
  &info
)
And once that is done info.dli_fbase holds the address of the SwiftUI dynamic library. This is the value we must pass for the dso argument:
os_log(
  .fault,
  dso: info.dli_fbase,
  log: OSLog(
    subsystem: "com.apple.runtime-issues",
    category: "ComposableArchitecture"
  ),
  "We encountered a runtime warning"
)
And if we execute this code in an application running in the simulator we will see something amazing:
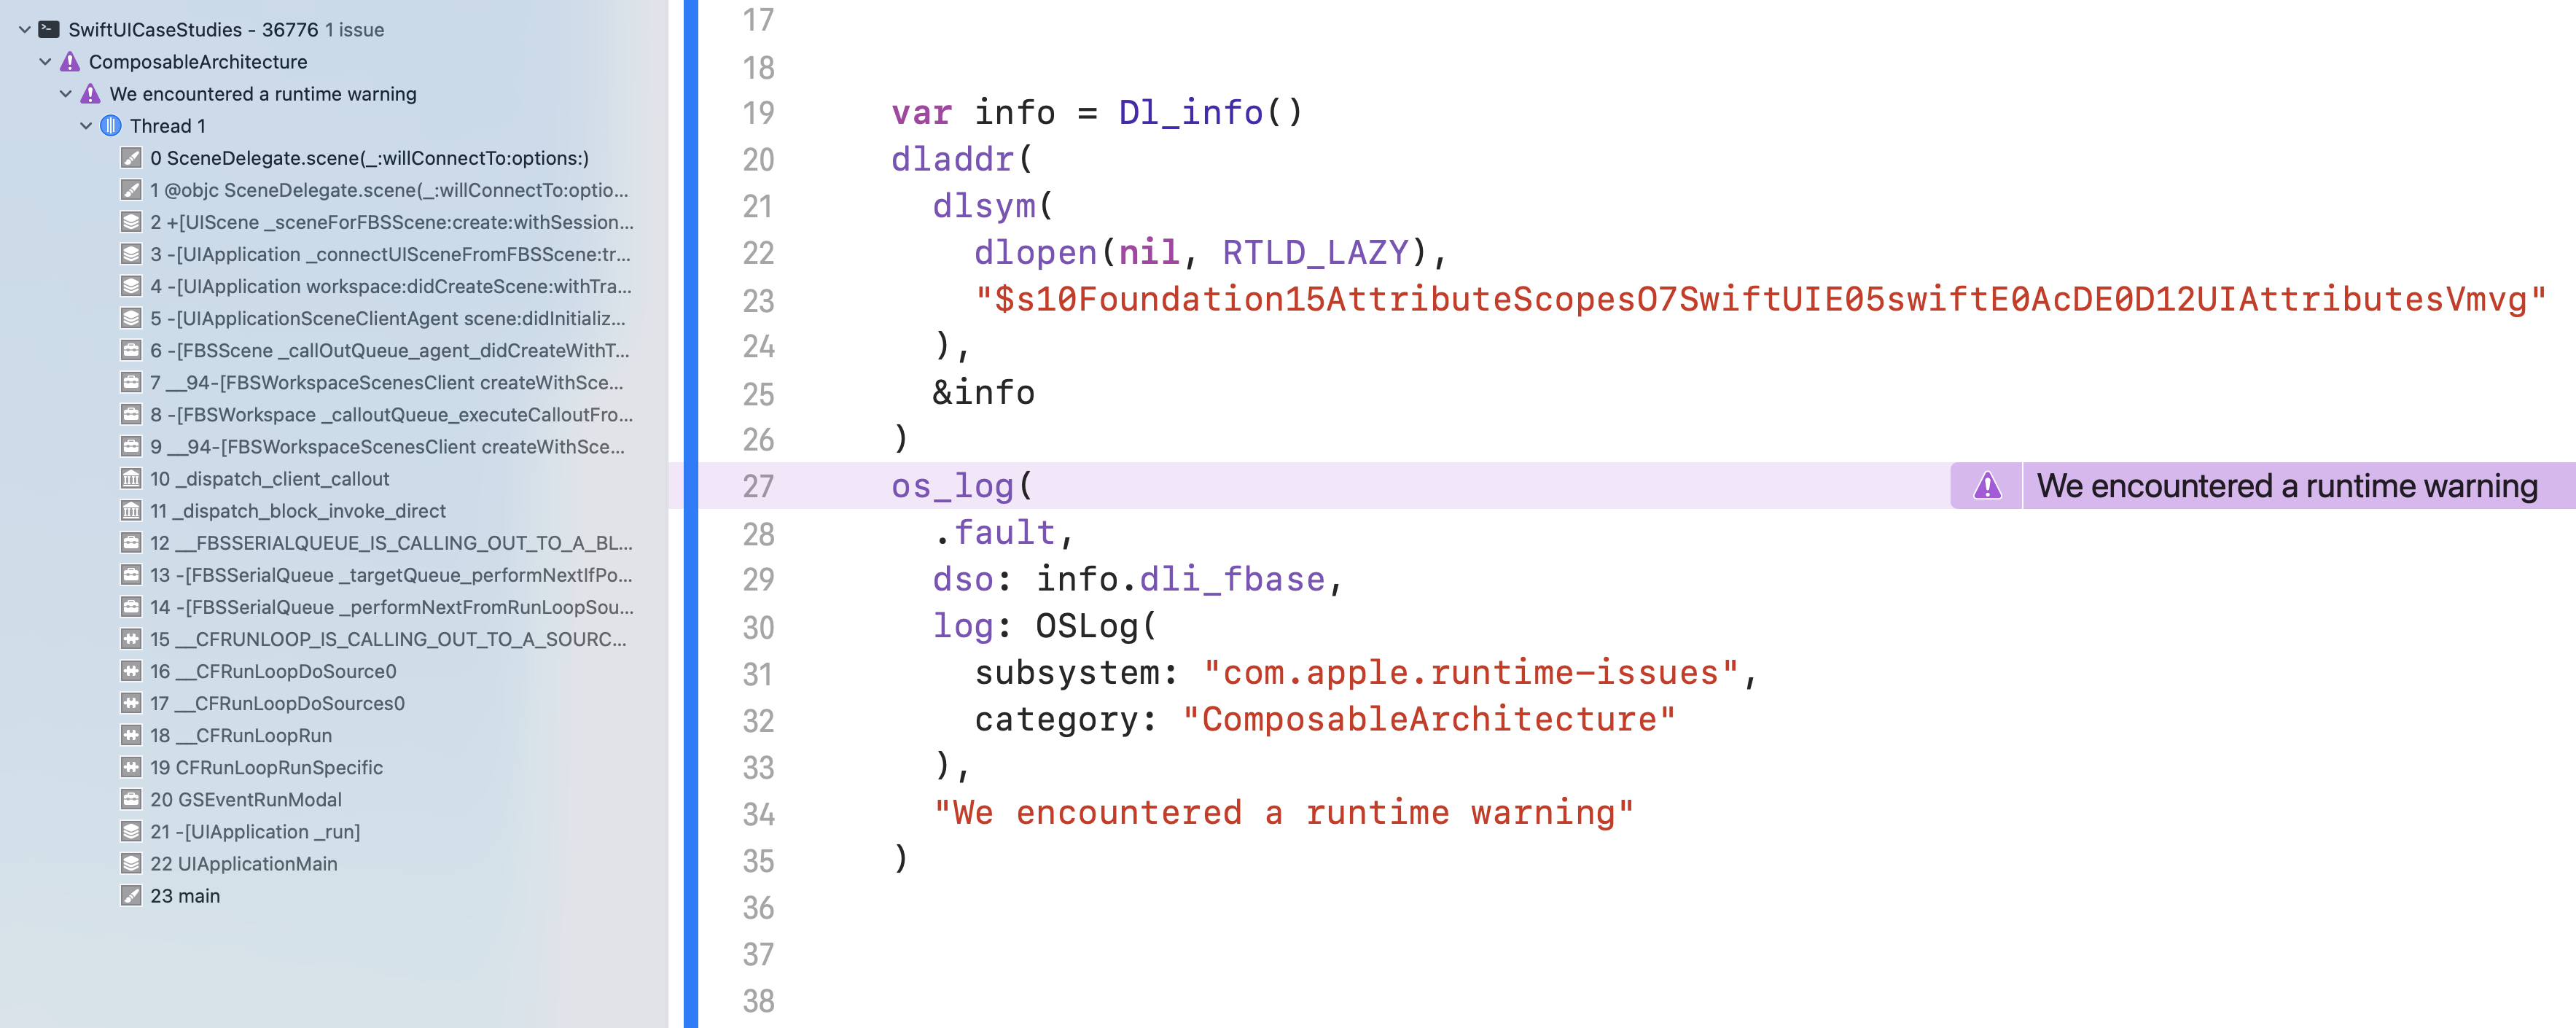
Xcode has displayed a purple warning directly on the line where we performed the os_log, and the warning has displayed in the issue navigator (⌘5) with the full stack trace captured at the moment the warning was logged!
If it wasn’t clear from our multiple uses of dynamic loading C functions that have no documentation whatsoever in Xcode let us make it clear: none of the above is officially endorsed by Apple. All of that code should be wrapped in #if DEBUG so that it is never shipped to the App Store, which may cause it to be rejected, and the code could easily break in future iOS releases.
However, we hope we have convinced you that having access to these kinds of warnings would be hugely beneficial to library maintainers, and so ideally Apple would provide first class support for this in Xcode. We encourage all of our readers and viewers to submit a duplicate our feedback asking for Apple to give developers access to these runtime warnings.
We have just released version 0.32.0 of the Composable Architecture that replaces all breakpoint warnings with new, unobtrusive warnings. We’ve been using it for the past few weeks while developing new features for isowords, and it’s a game changer in terms of developer productivity. We now have instant insight into moments we accidentally break invariants that the library expects us to uphold without disrupting what we are currently working on.
Update your projects to the new Composable Architecture release to give it a spin today, and let us know what you think!